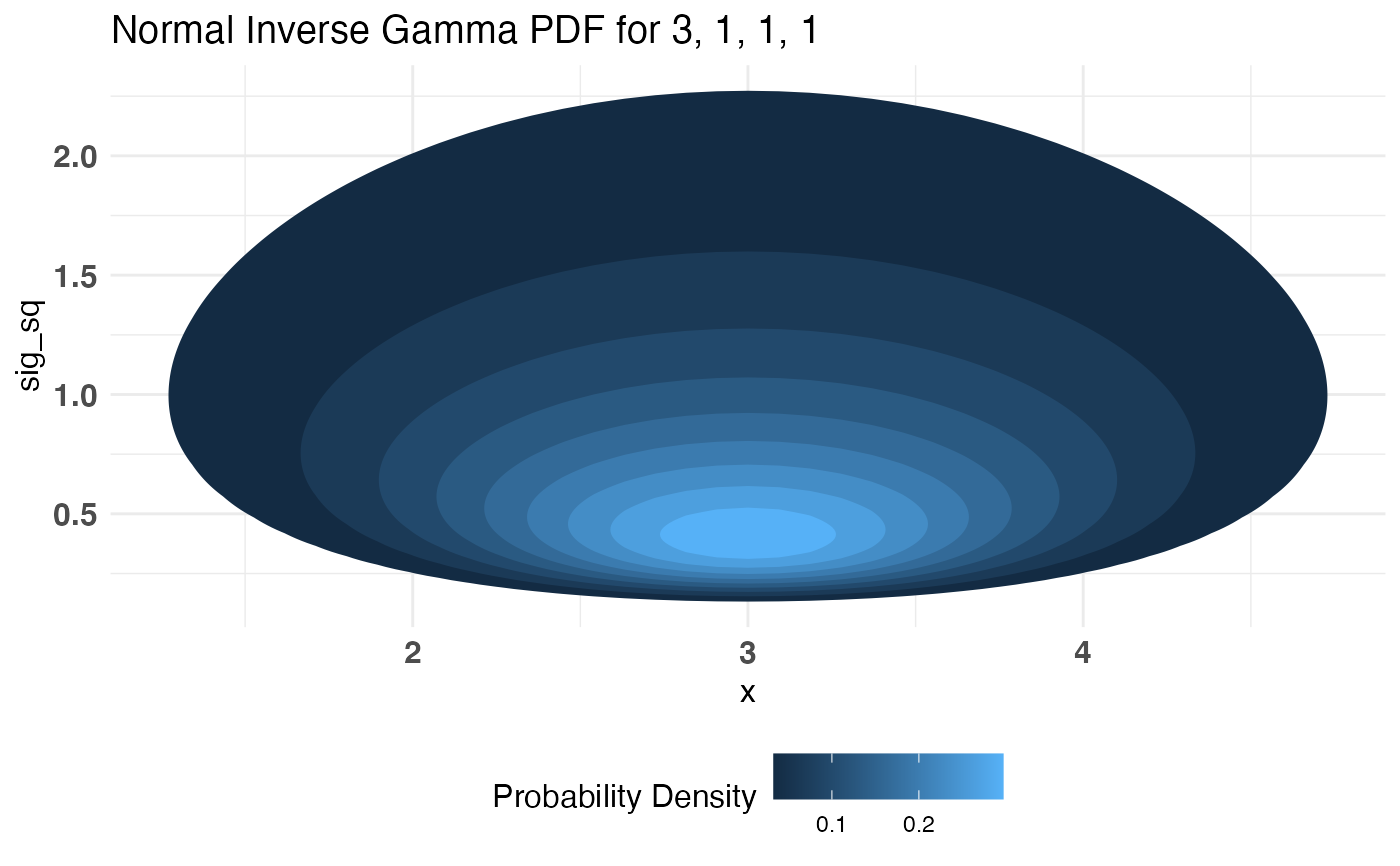
Plot the bivariate PDF of the Normal Inverse Gamma Distribution.
Source:R/plotDists.R
plotNormalInvGamma.RdPlot the bivariate PDF of the Normal Inverse Gamma Distribution.
plotNormalInvGamma(mu, lambda, alpha, beta)
Arguments
| mu | \(\mu\) parameter of the Normal Inverse Gamma distribution. |
|---|---|
| lambda | \(\lambda\) parameter of the Normal Inverse Gamma distribution. |
| alpha | \(\alpha\) parameter of the Normal Inverse Gamma distribution. |
| beta | \(\beta\) parameter of the Normal Inverse Gamma distribution. |
Value
The PDF of NormalInverseGamma(mu, lambda, alpha, beta)
Note
This is a bivariate distribution (commonly used to model mean and
variance of the normal distribution) and returns a 2d contour
plot instead of a typical one dimensional PDF. You may want to experiment
with both this distribution and the plotNormal and plotInvGamma
outputs separately before arriving at a suitable set of priors for the
Normal and LogNormal bayesTest.
Examples
plotNormalInvGamma(3, 1, 1, 1)
