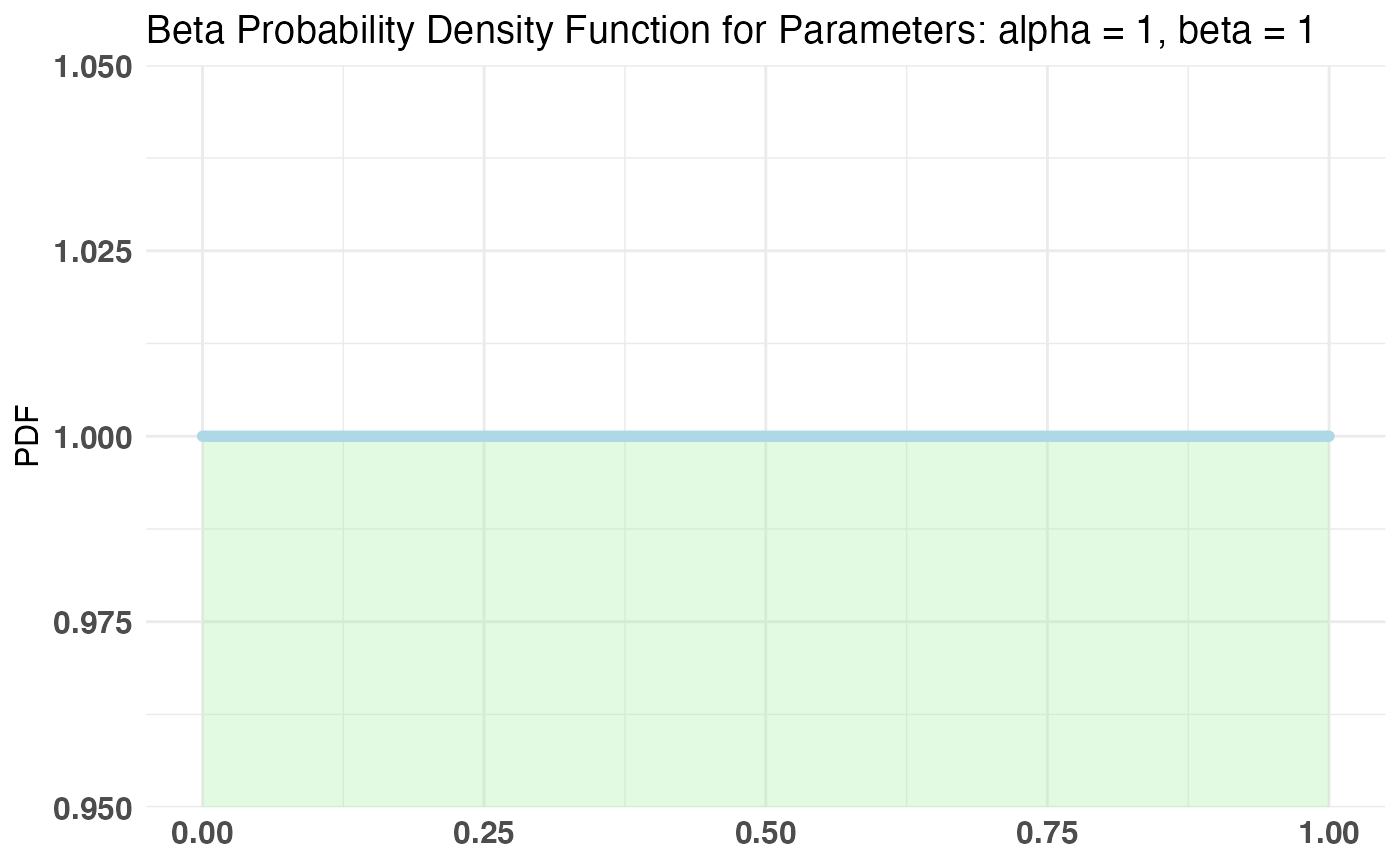
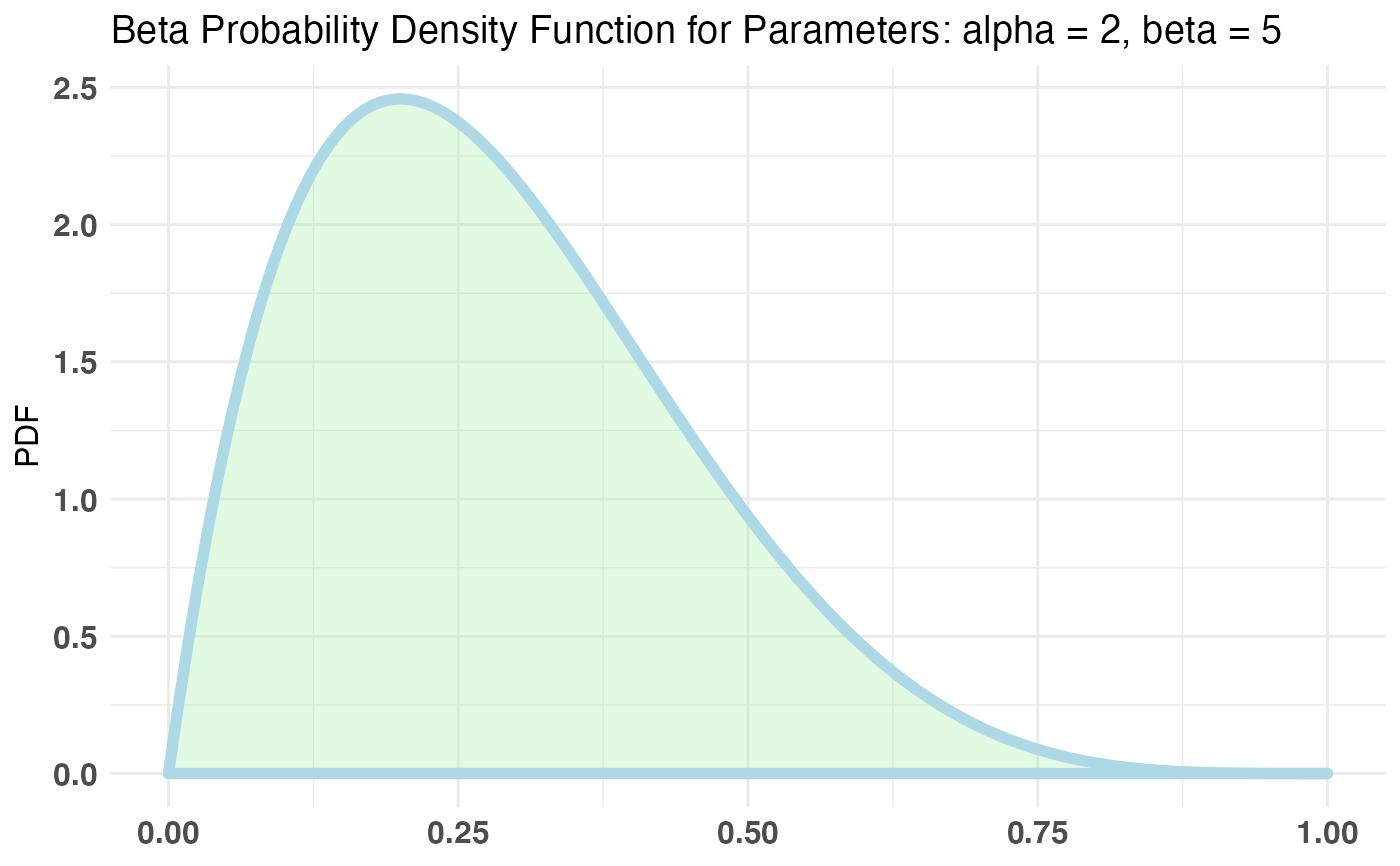
Plot the PDF of the Beta distribution.
plotBeta(alpha, beta)
Arguments
| alpha | \(\alpha\) parameter of the Beta distribution. |
|---|---|
| beta | \(\beta\) parameter of the Beta distribution. |
Value
The PDF of Beta(\(\alpha\), \(\beta\)).
Note
The output can be treated like any ggplot2 object and modified accordingly.
Examples
plotBeta(1, 1)plotBeta(2, 5)if (FALSE) plotBeta(2, 5) + ggtitle('I hate the default title!')