Plot method for objects of class "bayesTest".
# S3 method for bayesTest
plot(
  x,
  percentLift = rep(0, length(x$posteriors)),
  priors = TRUE,
  posteriors = TRUE,
  samples = TRUE,
  ...
)
Arguments
| x | an object of class "bayesTest" |
|---|---|
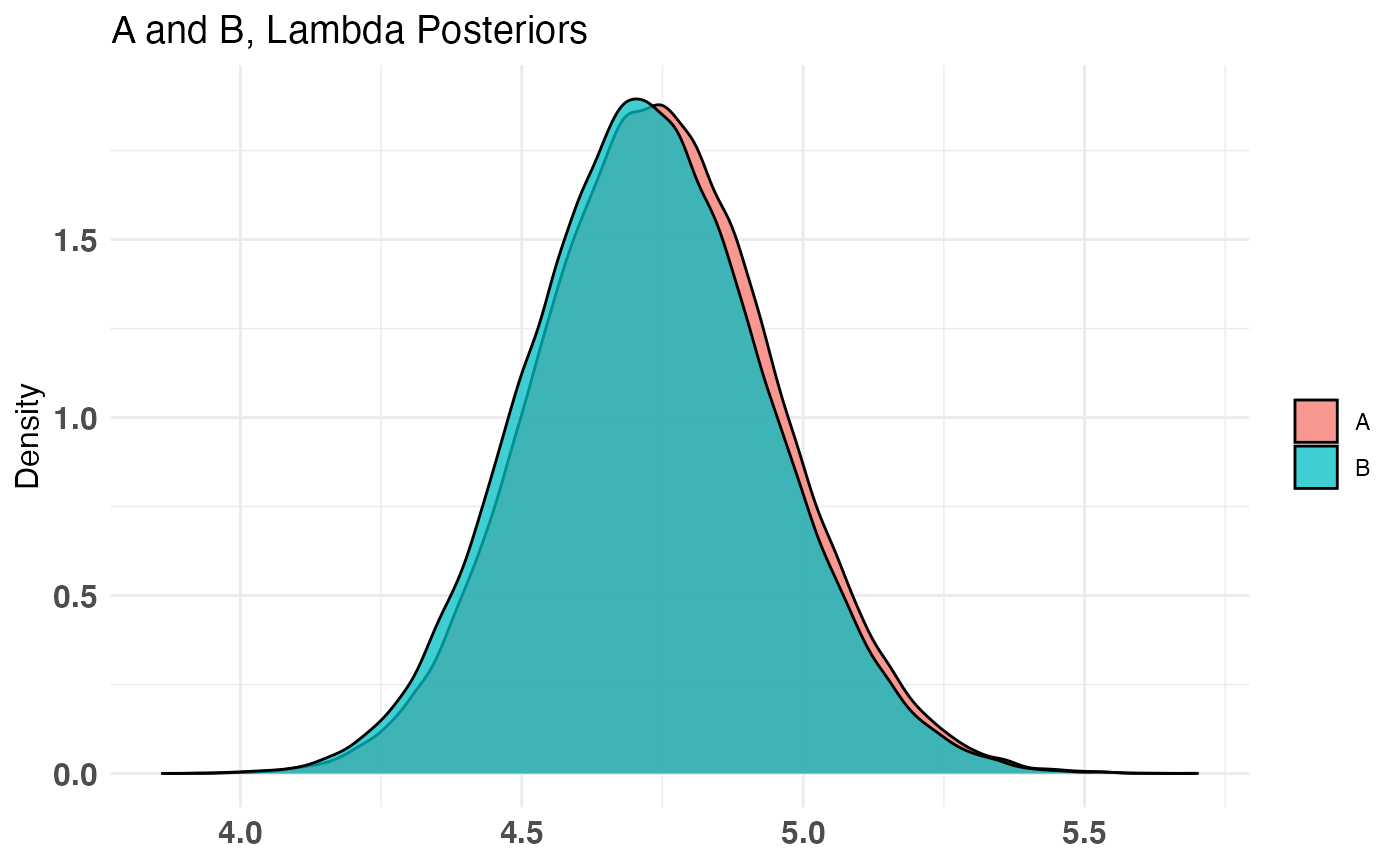
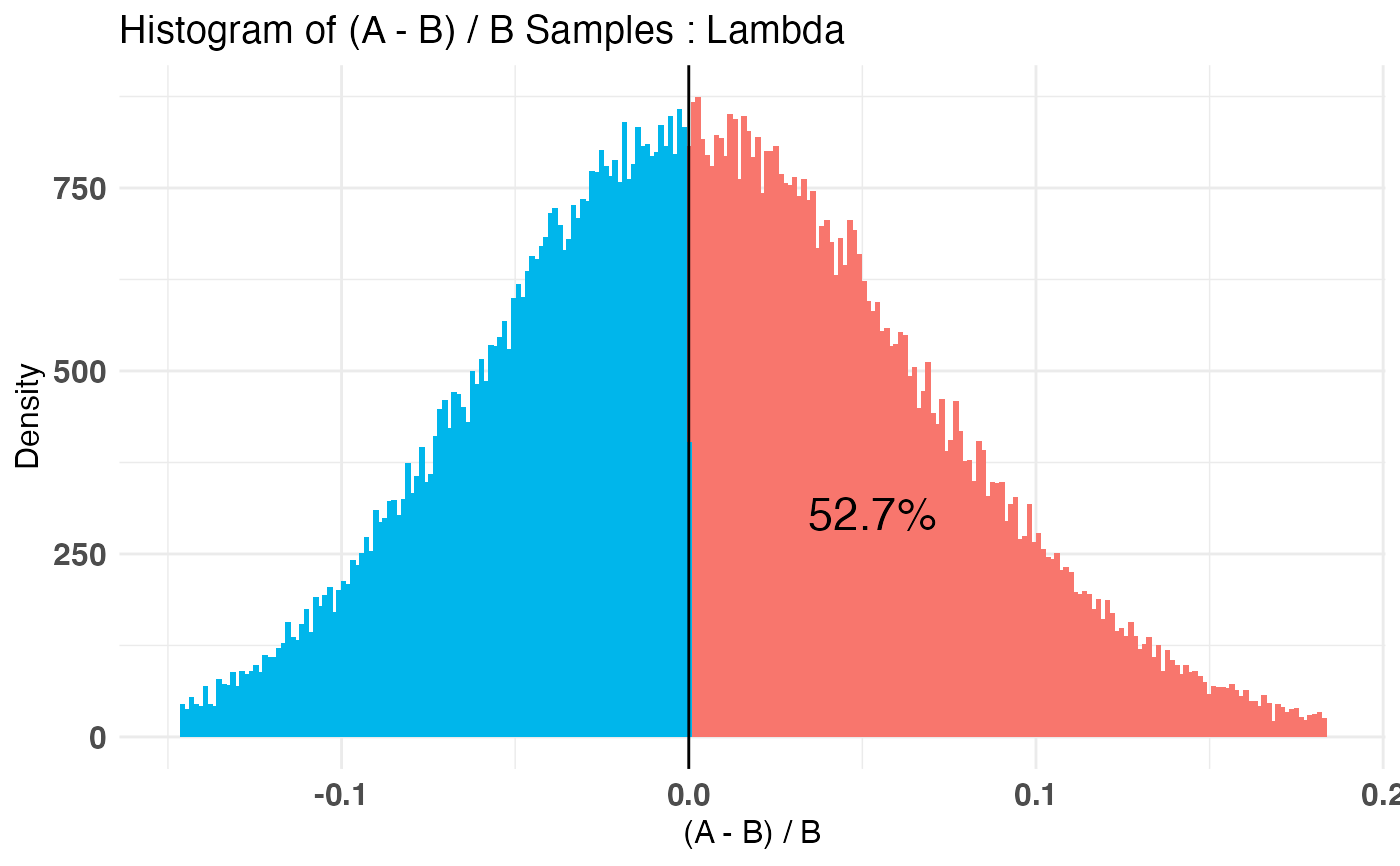
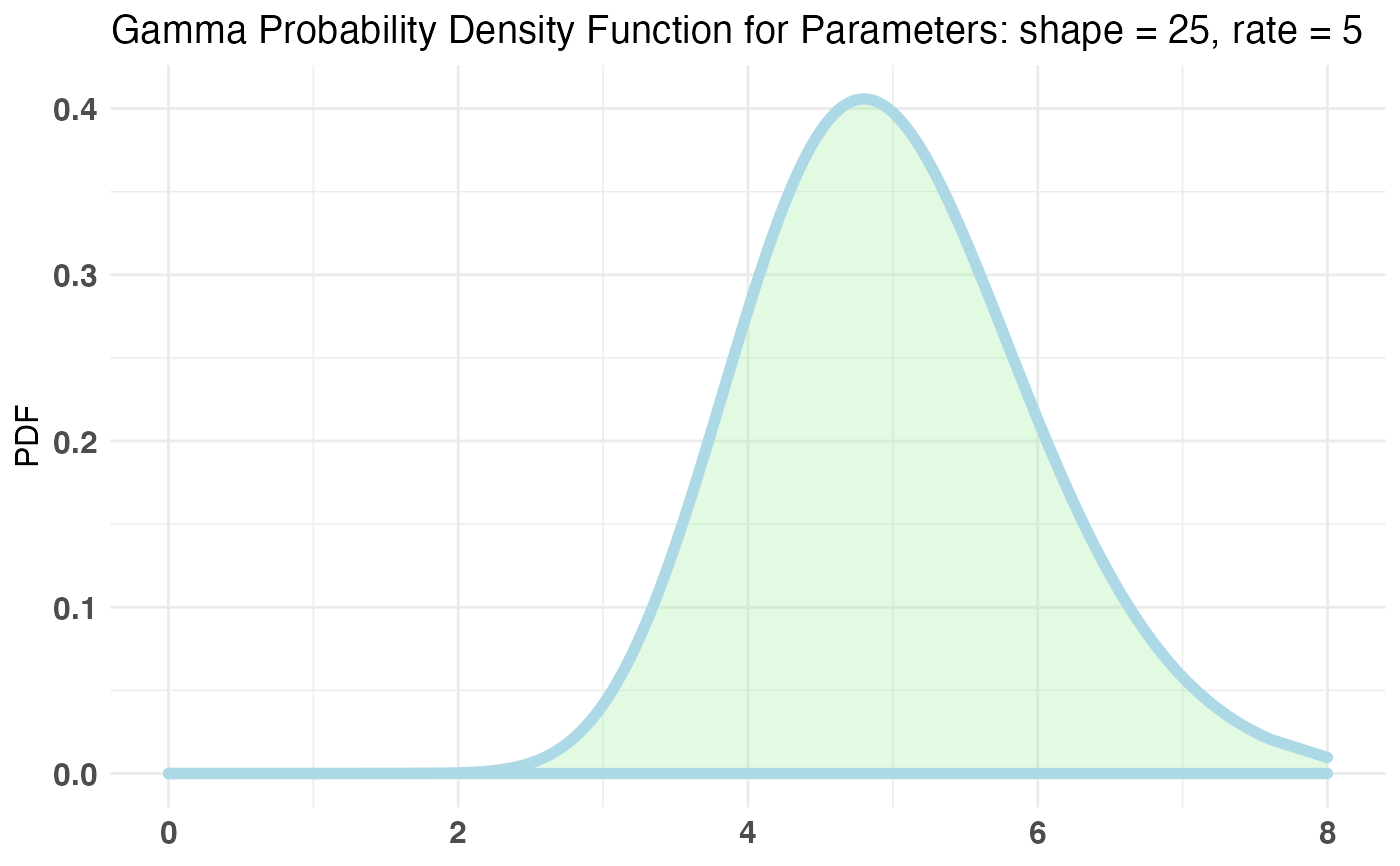
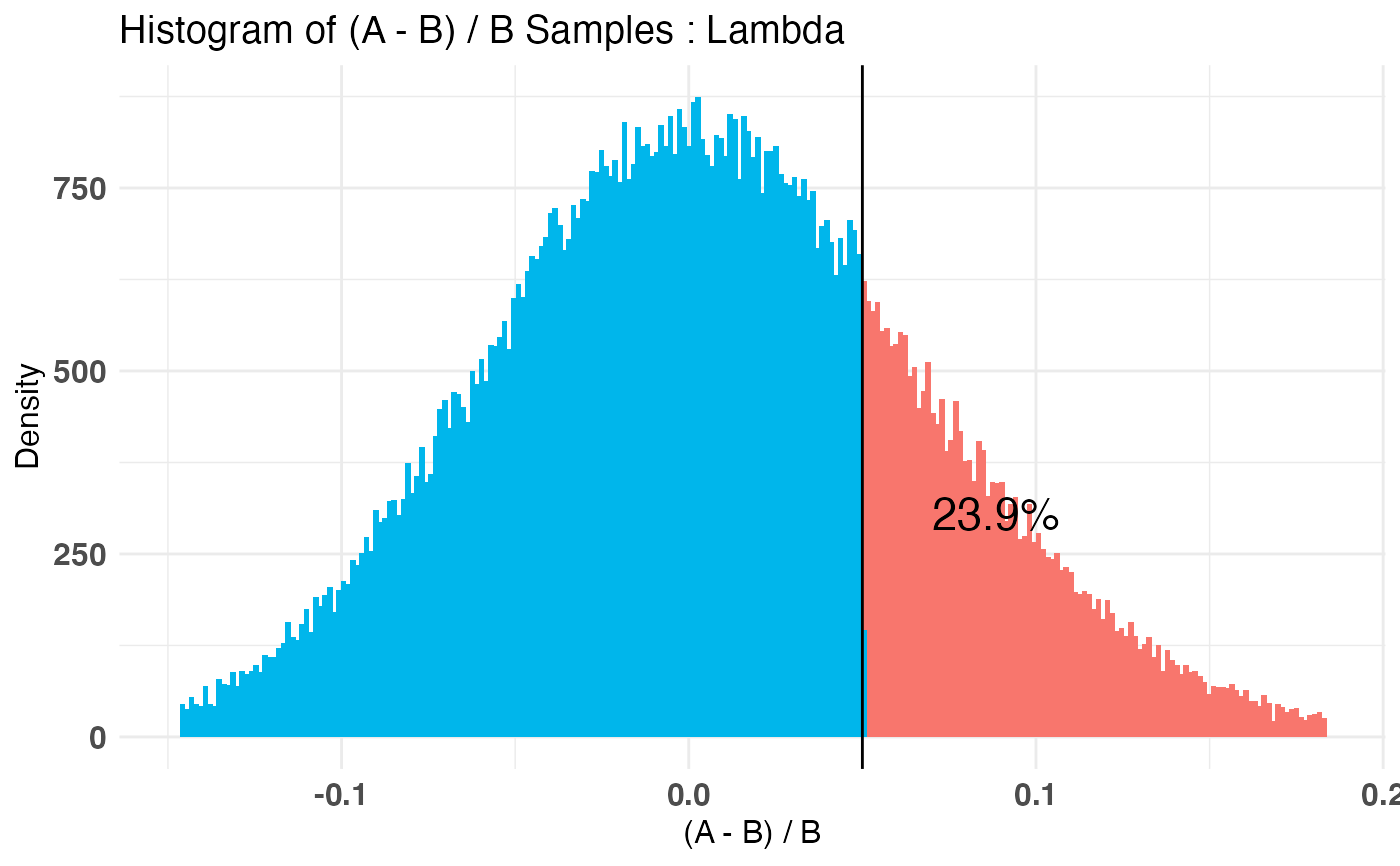
| percentLift | a vector of length(x$posteriors). Each entry corresponds to the percent lift ((A - B) / B) to plot for for the respective posterior in x. Note this is on a 'point' scale. percentLift = 5 implies you want to test for a 5% lift. |
| priors | logical indicating whether prior plots should be generated. |
| posteriors | logical indicating whether posterior plots should be generated. |
| samples | logical indicating whether sample plots should be generated. |
| ... | graphics parameters to be passed to the plotting routines. (For example |
Note
You can either directly plot a bayesTest object (in which case it will plot interactively), or you can save the plot
object to a variable and extract what you need separately. If extracted, you can treat it like any ggplot2 object and
modify it accordingly.
Plots are slightly truncated on the extremes to solve the general case of potentially long tail-ends.
Examples
A_pois <- rpois(100, 5) B_pois <- rpois(100, 4.7) AB1 <- bayesTest(A_pois, B_pois, priors = c('shape' = 25, 'rate' = 5), distribution = 'poisson') plot(AB1)# } if (FALSE) p$posteriors$Lambda + ggtitle('yolo') # modify ggplot2 object directly